Page 313 - 20dynamics of cancer
P. 313

298                                                CHAPTER 14

                                            (a) colon
                                         70
                                         60
                                         50
                                         40                            X
                                                                            X X   X
                                         30                 X X X       X
                                        Average methylation  10  X (b) endometrium  X
                                         20
                                                   X
                                                  X
                                            X
                                          0
                                         70
                                                      ≥ 3
                                               obese children
                                         60
                                                 +
                                         50
                                                 −
                                                 +    − − +
                                         40      −    +
                                         30
                                         20
                                         10
                                          0
                                           0        20       40       60      80
                                                              Age


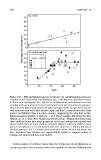
                              Figure 14.5  DNA methylation measures mitotic age. (a) Methylation increases
                              steadily in the colon with chronological age, reflecting the continual mitosis
                              in this tissue throughout life. (b) In the endometrium, methylation increases
                              steadily with age during menstrual cycling and then plateaus after menopause.
                              Obese women (filled symbols) have higher estrogen levels and greater endome-
                              trial turnover than non-obese women (open symbols). Obese women also have
                              greater methylation than non-obese women, supporting the idea that methy-
                              lation measures number of mitoses: 7 of 8 obese samples fall above the line,
                              whereas 11 of 17 non-obese women fall below the line. Women with fewer than
                              three children (stars) have more menstrual cycles and endometrial renewal than
                              women with three or more children (circles). Women with few children have
                              greater methylation: 11 of 14 women with less than three children fall above
                              the line, whereas 9 of 11 women with more than three children fall below the
                              line. Redrawn from Shibata and Tavare (2006), based on original studies in
                              Yatabe et al. (2001) and Kim et al. (2005).


                                Various lines of evidence show that the frequency of methylation at
                              certain genomic sites increases with the number of mitoses (Shibata and
   308   309   310   311   312   313   314   315   316   317   318