
Page 312 - 20dynamics of cancer
P. 312
CELL LINEAGE HISTORY 297
(a) A 1
−
MMR A 2
ancestor C 1
C
2
(b)
− A
MMR
ancestor C
1
C 2
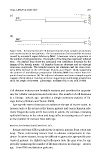
Figure 14.4 Reconstruction of cell lineage histories from samples of adenoma
and cancer tissues in two patients. The accumulation of microsatellite variation
−
caused by mismatch repair deficiency (MMR ) measures time in proportion to
the number of cell generations. The lengths of the branches represent inferred
time. The dashed lines show the estimated 95% confidence intervals for the
timing of the branch points. (a) Samples from an adenoma and an adjacent
cancerous outgrowth. The branch between the adenoma and the cancer hap-
pens fairly far back in the cell lineage history, as in Figure 14.3b, supporting
the pattern of multilineage progression following MMR loss rather than fre-
quent clonal successions. (b) The adjacent adenoma and cancer samples again
suggest a fairly distant common ancestor, supporting multilineage progression
since the origin of the MMR − phenotype. Redrawn from Tsao et al. (1999).
Cell division induces new heritable variants and provides the opportu-
nity for cellular competition and selection. The number of cell divisions
in a lineage—mitotic age—provides a simple summary statistic of lin-
eage history (Shibata and Tavare 2006).
Age-specific rates of mitosis can influence the age of cancer onset. In
tissues such as the retina or the bones, mitosis and cancer happen rela-
tively frequently early in life but rarely in adults. By contrast, renewing
epithelial tissues in the colon and lung suffer increasing rates of cancer
as the number of mitoses rises with age.
METHYLATION MEASURES MITOTIC AGE
Retina and bone differ qualitatively in mitotic pattern from colon and
lung. These contrasting tissues lead to obvious comparisons in inci-
dence. In other tissues, it may be difficult to guess the age-specific pat-
terns of mitosis. So, Shibata and colleagues took the next step, by em-
pirically estimating the number of lifetime mitoses in a lineage—mitotic
age—from DNA methylation patterns.