
Page 247 - 20dynamics of cancer
P. 247
232 CHAPTER 11
900
800
700 45−55 years
Incidence 600
500
>55 years
400
<45 years
300
0 4 8 12 16 20 24 28
Years since first primary breast cancer
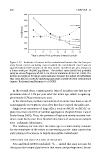
Figure 11.7 Incidence of cancer in the contralateral breast after the first pri-
mary breast cancer, excluding cases in which the contralateral cancer was di-
agnosed within three months of the first cancer. Incidence per year shown on
a linear scale per 100,000 population. The earliest cases (solid line) probably
carry an excess frequency of BRCA1 or BRCA2 mutations (Peto et al. 1999). The
decline in incidence for those cases may arise because the subset of individuals
who carry BRCA1 or BRCA2 mutations may more rapidly develop contralateral
tumors. Redrawn from Hartman et al. (2005).
In the second class, a monozygotic twin of an index case has an ap-
proximate risk of 1.3% per year after the index age, which is again ap-
proximately 0.7% per breast per year.
In the third class, mothers and sisters of an index case have a risk of
approximately 0.3–0.4% per year after they have passed the index age.
Single locus mutations of large effect, such as BRCA1 or BRCA2, ex-
plain less than one-fifth of familial aggregation (Anglian Breast Cancer
Study Group 2000). Thus, the patterns of high and nearly constant inci-
dence most likely arise from familial inheritance of variants at multiple
sites—polygenic inheritance.
The tendency for risk after the index age to remain nearly constant
for the remainder of life raises an interesting puzzle: what causes that
early plateau of incidence in highly susceptible individuals?
HYPOTHESIS FOR EARLY PLATEAU OF INCIDENCE
Peto and Mack (2000) concluded: “A ... model that may account for
these peculiar temporal patterns is that many, and perhaps most, breast