
Page 307 - 16Neonatal Jaundice_compressed
P. 307
Neonatal jaundice
Bibliographic details Study type & Patient characteristics Test, Reference Standard, Results Reviewers Comments
Evidence level Threshold for a positive test
curve, N = Not reported)
Area = 0.89
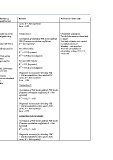
Szabo P; Study Type: Healthy full-term babies (37–41 weeks) 1) Clinical assessment by nurses Comparison 1: Unselected population
Diagnostic study with BW > 2000 g and no older than and primary investigator using Test & Reference test described
Year: 2004 6 days. Kramer criterion Correlation of estimated TSB levels with lab in detail
Evidence Level: TSB (Pearson correlation coefficient, Test and reference test carried
Country: II (n = 140, 92 white and 48 non-white 2) TcB using Minolta JM-102 at N = not reported) out within one hour
Switzerland babies, median BW 3320 g) the sternum Blinding – not specified
range 2050 to 4400 g (higher of two readings used for For white babies Data not extractable for
56 median GA: 39 weeks – range 37 to analysis) 2 calculating values of TP, FP,
41.9 weeks R = 0.74 (by nurse) TN & FN
2
Gender: Not reported 3) TcB using BiliChek at the R = 0.70 (by investigator)
forehead and sternum
Ethnicity (mean of 5 readings used for For non-white babies
2
white = 66% analysis) R = 0.71 (by nurse)
Asian = 13% 2
Other = 21% Reference standard: Laboratory R = 0.65 (by investigator)
TSB levels within 30 min
Exclusion: Diagnostic accuracy for detecting TSB
Haemolysis For diagnostic accuracy: > 250 micromol/litre (Area underROC
jaundice within first 36 hours Area under ROC curve calculated curve, N = Not reported)
phototherapy for detecting TSB Area = 0.84
> 250 micromol/litre
Comparison 2:
Correlation of TcB levels with lab TSB levels
(Pearson correlation coefficient, N = Not
reported)
2
R = 0.82, P < 0.01
Diagnostic accuracy for detecting TSB
> 250 micromol/litre (Area under ROC
curve, N = Not reported)
Area = 0.98
Comparison 3 (at forehead):
Correlation of TcB levels with lab TSB levels
(Pearson correlation coefficient, N = Not
reported)
2
R = 0.79, P < 0.01
Diagnostic accuracy for detecting TSB
> 250 micromol/litre (Area under ROC
curve, N = Not reported)
226