
Page 225 - 16Neonatal Jaundice_compressed
P. 225
Appendix H: Evidence tables
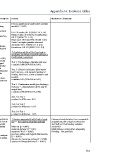
Bibliographic details Study type and Patient characteristics Methodology and interventions Results Reviewers Comments
Evidence level
care nursery for any reason maternal race, Factors significant in multivariate analysis
Babies who received intravenous intended method of feeding, model (P < 0.05)
antibiotics for concern for sepsis. GA,
history of previous infant with GA< 38 weeks OR 19 (95% CI 6.3- 56)
jaundice, Mother’s plan of exclusive breastfeeding:
clinical assessment of jaundice, OR 3.7 (95% CI 1.1- 13)
G6PD deficiency.
Black race: OR 0.22 (95% CI 0.08- 0.61)
Test 3: Grade 4 or higher jaundice observed
clinically: OR 1.7 (95% CI 1.2–2.6)
Combination of pre-discharge Female sex: OR 3.2 (95% CI 1.2–8.4)
bilirubin risk zone and clinical
risk factors.
2) Predictive ability of the three tests in
Reference standard: predicting significant hyperbilirubinaemia
(multivariate regression)
Bilirubin levels (TcB or TSB)
measured on day 3–5 on both Test 1: Pre-discharge bilirubin risk zone
hospitalised and discharged c-statistic 0.88 (95% 0.85 to 0.91)
babies (at home) using similar
method as in Test 1, and Test 2: Clinical risk factors (final model
Significant Hyperbilirubinaemia had 5 factors – GA, intended method of
defined as bilirubin levels feeding, black race, extent of jaundice and
exceeding or within gender)
17 micromol/litre of the hour-
specific phototherapy treatment c-statistic 0.91 (95% 0.86 to 0.97)
thresholds. Test 3: Combination model (pre-discharge
risk zone + clinical factors of GA and %
weight loss)
c-statistic 0.96 (95% 0.93 to 0.98)
Test 3 vs Test 1
p-value for difference< 0.01
Test 3 vs Test 2
p-value for difference = 0.15
Test 2 vs Test 1
p-value for difference = 0.35
Gale R; Study Type: Term babies > 37 weeks delivered 1) Association of various factors 1) Factors associated high bilirubin levels Cases and controls taken from comparable
Nested case– during a 5 year period in a with high serum bilirubin levels (at P < 0.01 during univariate analysis) populations with exclusion criteria not
Year: 1990 control study university hospital (n = 10 122) by comparing test group with well defined Confounding variables
comparison group (univariate Male sex (p =0.001) controlled
Country: Evidence Level: II Test group: analysis) maternal diabetes (P = 0.01) Methodology not described adequately
Israel Term babies who developed serum maternal PIH (P = 0.005) Blinding – not specified
bilirubin previous sibling with hyperbilirubinaemia
15 levels = 221 micromol/litre 2) Step-wise regression analysis (P < 0.001)
n = 1154 done to control for confounding delivery by caesarean section (P < 0.001)
variables vacuum or forceps delivery (P < 0.001)
185