
Page 216 - 16Neonatal Jaundice_compressed
P. 216
Appendix H: Evidence tables
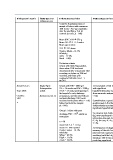
Bibliographic details Study type and Patient characteristics Methodology and interventions Results Reviewers Comments
Evidence level
Controls: Randomly selected 2) Factors independently associated with
sample of babies with maximum severe hyperbilirubinaemia from
TSB levels < 427 micromol/litre multivariate regression analysis (adj OR
after the qualifying TSB (4 with 95% CI)
controls per case, n = 248)
GA (compared to 40 weeks as reference)
Mean BW: 3414 ± 576 g For 38–39 weeks: 3.1 (1.2–8.0); P = 0.02
Mean GA: 37.9 + 1.4 weeks For 34–37 weeks: 3.7 (0.6–22.7); P = 0.15
Mean age at entry: Family history of jaundice: 3.8 (0.9–15.7):
73.1 ± 17.5 hours P = 0.06
Bruising on examination: 2.4 (1.2–4.8);
Gender: Males = 61.3%
Ethnicity: P = 0.02
asian = 29.8% Exclusive breastfeeding after qualifying
TSB: 2.0 (1.03–4.0); P = 0.04
black = 6.8% TSB increase of = 102 micromol/litre per
day: 2.5 (1.2–5.5); P = 0.02
Exclusion criteria:
infants with resolving jaundice,
those where TSB levels not Accuracy of risk factor model in predicting
severe hyperbilirubinaemia
documented after a maximum TSB
recording or decline in TSB not c-statistic 0.82 (0.76 to 0.88)
recorded, and those with
conjugated bilirubin level = 2
MG/DL
Keren R et al.; Study Type: Infants with BW = 2000 g if 1) Association of risk factors Prevalence of significant Retrospective cohort study
Retrospective GA = 36 weeks and BW = 2500 g with significant hyperbilirubinaemia Unselected population with well defined
Year: 2005 cohort if GA = 35 weeks participating in hyperbilirubinaemia derived exclusion criteria
the hospital’s early discharge from univariate analysis (at P Confounding variables controlled
Country: Evidence Level: II programme, and who had both pre < 0.2) 98/899 (10.9%) Methodology described adequately
USA and post-discharge TSB levels 1) Factors associated with significant Blinding – not specified
measured at the phase when ≥ 75% 2) Multivariate regression
12 babies had both the samples analysis used to find factors hyperbilirubinaemia
(n = 899) independently associated with
significant hyperbilirubinaemia Increased risk
Group 1: infants with post- GA < 38 weeks (P = 0.02)
th
discharge TSB > 95 centile on To calculate risk, birthweight GA ≥ 40 weeks (P = 0.12)
nomogram (kg) was transformed by large for gestational age babies (P = 0.13)
th
subtracting 2 kg and dividing by higher pre-discharge TSB risk zone > 76
n = 98 0.5 kg for every 0.5 kg above centile (P < 0.001)
2.5 kg
mean BW: 3.4 ± 0.5 kg breastfeeding (P < 0.001)
mean GA: Not reported 3) Comparison of diagnostic combined breast and bottle feeding
Gender: males = 54.1% accuracy of the risk factor score (P = 0.02)
maternal diabetes (P = 0.17)
Ethnicity: (derived from regression vacuum extraction (P < 0.001)
White = 45.9% modeling) with that of pre- prolonged rupture (P = 0.08)
Black = 31.6% discharge TSB levels in
Asian = 10.2% predicting significant oxytocin use (P = 0.002)
181