
Page 141 - Screening for Cervical Cancer: Systematic Evidence Review
P. 141
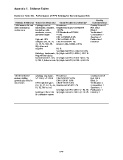
Appendix C. Evidence Tables
Evidence Table 3A. Performance of HPV Testing for Screening (contd)
Quality
Patients & Methods Outcomes Measured Study Results & Limitations* Considerations
2,988 women 34 and Cytology read as Prevalence: Quality Score=11
older undergoing inadequate, negative, Negative/no biopsy=2855/2988 Ref. Std:2
routine care borderline, mild, =95.6% Blind:2
moderate, severe, HPV/borderline=57/2988 Verification:2
glandular atypia =1.9% Consecutive:2
CIN 1=27/2988=0.9% Spectrum:1
High risk HPV CIN 2=8/2988=0.3% Publication:1
subtypes (16, 18, 31, CIN 3=33/2988=1.1% Industry:1
33, 35, 51, 522, 56, Adeno in situ=1/2988=0.03%
58), other and
negative HC II:
Se (High risk HPV, LGSIL+)=61.0%
Histology: Inadequate, Sp (High risk HPV, LGSIL+)=95.1 %
Negative/no biopsy,
borderline/CIN 1, CIN Se (High risk HPV, HGSIL+)=95.2 %
2, CIN 3, Adeno in situ Sp (High risk HPV, HGSIL+)=94.3 %
138 HIV-infected cytology: any atypia, Prevalence: Quality Score=9
women visiting >/= CIN I, >/= CIN II CIN I=20/138=14.5% Ref. Std: 2
gynecologic clinic for CIN II=5/138=3.6% Blind: 0
any reason HPV: high risk types CIN III=9/138=6.5% Verification: 2
(16, 18, 31, 33, 35, 45, invasive ca=3/138=2.2% Consecutive: 2
51, 52, 56) vs. not Spectrum: 1
Se (High risk HPV, CIN II +)= 94.1% Publication: 1
histology: CIN II, CIN Sp (High risk HPV, CIN II +)= 70.3% Industry: 1
III or invasive cancer
C-47