Page 109 - Screening for Cervical Cancer: Systematic Evidence Review
P. 109

Appendix C.  Evidence Tables


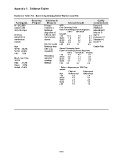
               Evidence Table 1A.  Screening Among Older Women (cont'd)

                                 Screening     Outcomes &                                         Quality
                 Participants    Program        Measures             Relevant Results         Considerations
               N = 312,858                   Primary        AGE:                              Denom=2
               women with                    Outcome =      First Screening Cycle             Attrition=0
               407,246 Paps                  histologic     Rates* of histology-proven diagnoses    Indications=1
                                             diagnoses of                   CIN 2       CIN 3/CIS       Interval=0
               Services                      CIN 2,3, CIS   Invasive                          Age=2
               intended for                  and invasive   < 30        11.0              7.9                 0.1   Relevance=2
                                                            30-39        4.9              6.7                 0.4
               low-income                    cancer         40-49        2.0              3.2                 0.5   Standard=0
               women                                        50-64        0.9              1.7                 0.6  Score=7
                                             (all cases with   ≥ 65        0.5              1.4                 0.3
               Age                           histology from                                   Grade=Fair
               40-49    25.2%                CIN 1, up      Second Screening Cycle
               50-64   24.9%                 reported)      Rates* of histology-proven diagnoses
               ≥ 65      7.6%                                              CIN 2       CIN 3/CIS     Invasive
                                             Secondary      < 30          7.6              4.2                0.1
                                                            30-39       3.8               4.1                0.4
               Black, non-Hisp               outcome =      40-49       1.7               1.3                0.2
               10.3%                         cytology       50-64       0.7               1.2                0.1
               Hisp      21.2%               findings       ≥ 65       0.8               0.7                0.0
               Asian      2.3%
               AmInd  10.4%                                 * Rates = diagnoses per 1000 Pap
                                                            smears
                                                                              First test               Subsequent
                                                            Age           % Abnormal          %Abnormal
                                                            < 30                  8.2                         7.4
                                                            30-39                4.3                         4.2
                                                            40-49                2.3                         2.3
                                                            50-64                1.4                         1.5
                                                            ≥ 65                  1.0                         1.0


                                                            C-15
   104   105   106   107   108   109   110   111   112   113   114