
Page 12 - PII: S0044-8486(99)00371-3
P. 12
)
100 D. Lemos et al.rAquaculture 186 (2000 89–105
˜
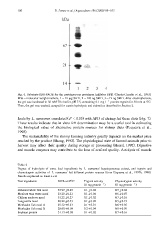
Fig. 6. Substrate-SDS-PAGE for the proteinaceous proteinase inhibitor SBTI ŽGarcia-Carreno et al., 1993 . .
MWsmolecular weight markers, 1s12 mg SBTI, 2s120 ng SBTI, 3s12 ng SBTI. After electrophoresis,
the gel was incubated in 50 mM Tris buffer, pH 7.5, containing 0.1 mg l y1 porcine trypsin for 30 min at 58C.
Then, the gel was washed, assayed for casein hydrolysis and stained as described in Section 2.
feeds by L. Õannamei correlated Ž P-0.05 with APD of shrimp fed these diets Fig. 7 .
.
Ž
.
These results indicate that in vitro DH determination may be a useful tool in estimating
the biological value of alternative protein sources for shrimp diets ŽEzquerra et al.,
1998 ..
The sustainability of the shrimp farming industry greatly depends on the market price
reached by the product ŽShang, 1992 . The physiological state of farmed animals prior to
.
harvest may affect their quality during storage or processing ŽHaard, 1992 . Digestive
.
and muscle enzymes may contribute to the loss of seafood quality. Autolysis of muscle
Table 2
Degree of hydrolysis of some feed ingredients by L. Õannamei hepatopancreas extract, and trypsin and
chymotrypsin activities of L. Õannamei fed different protein sources Žfrom Ezquerra et al., 1997b, 1998 . .
Results expressed as mean"s.d.
Test ingredients DH% at 258C Trypsin activity Chymotrypsin activity
ŽU mg protein y1 . ŽU mg protein y1 .
Deboned white fish meal 33.99"0.45 0.1"0.02 0.5"0.04
Mexican tuna waste meal 23.20"0.21 0.1"0.04 0.6"0.07
Chilean anchovy meal 31.22"0.27 0.1"0.02 0.7"0.16
Langostilla meal 28.22"0.43 0.1"0.02 0.5"0.19
Menhaden fish meal A 25.32"0.23 0.1"0.01 0.6"0.05
Menhaden fish meal B 28.60"0.10 0.2"0.04 0.8"0.09
Soybean protein 31.13q0.10 0.1"0.02 0.7"0.16