
Page 164 - 49A Field Guide to Genetic Programming
P. 164
150 A Resources
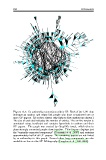
Figure A.1: Co-authorship connections within GP. Each of the 1,141 dots
indicates an author, and edges link people who have co-authored one or
more GP papers. (To reduce clutter only links to first authors are shown.)
The size of each dot indicates the number of entries. The on-line version is
annotated using JavaScript and contains hyperlinks to authors and their
GP papers. The graph was created by GraphViz twopi, which tries to
place strongly connected people close together. This diagram displays just
the “centrally connected component” (Tomassini et al., 2007) and contains
approximately half of all GP papers. The remaining papers are not linked
by co-authorship to this graph. Several other large components are also
available on-line via the GP Bibliography (Langdon et al., 1995-2008).