
Page 556 - untitled
P. 556
Peter J. Wallison 527
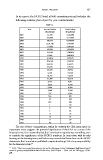
In its report, the NCRC listed all 446 commitments and includes the
following summary list of year-by-year commitments:
Table 13.
Year Annual Dollars Total Dollars
($ millions) ($ millions)
2007 12, 500 4,566,480
2006 258,000 4,553,980
2005 100,276 4,298,980
2004 1,631,140 4,195,704
2003 711,669 2,564,564
2002 152,859 1,852,895
2001 414,184 1,700,036
2000 13,681 1,285,852
1999 103,036 1,272,171
1998 812,160 1,169,135
1997 221,345 356,975
1996 49,678 135,630
1995 26,590 85,952
1994 6,128 59,362
1993 10,716 53,234
1992 33,708 42,518
1991 2,443 8,811
1990 1,614 6,378
1989 2,260 4,764
1988 1,248 2,504
1987 357 1,256
1986 516 899
1985 73 382
1984 219 309
1983 1 90
1982 6 89
1981 5 83
1980 13 78
1979 15 65
1978 0 50
1977 50 50
Th e size of these commitments, which far outstrip the CRA loans made in
assessment areas, suggests the potential signifi cance of the CRA as a cause of the
fi nancial crisis. It is noteworthy that the Commission majority was not willing even
to consider the signifi cance of the NCRC’s numbers. In connection with its only
hearing on the housing issue, and before any research had been done on the NCRC
statements, the Commission published a report absolving CRA of any responsibility
for the fi nancial crisis. 154
154 FCIC, “Th e Community Reinvestment Act and the Mortgage Crisis.” Preliminary Staff Report, http://
www.fcic.gov/reports/pdfs/2010-0407-Preliminary_Staff _Report_-_CRA_and_the_Mortgage_Crisis.
pdf.