
Page 421 - untitled
P. 421
FINANCIAL CRISIS INQUIRY COMMISSION REPORT
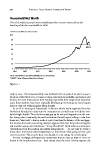
Household Net Worth
The crisis wiped out much more wealth than other recent events such as the
bursting of the dot-com bubble in 2000.
IN TRILLIONS OF DOLLARS
$70
60
50
$54.9
40
30
20
10
0
1952 1960 1970 1980 1990 2000 2010
NOTE: Net worth is assets minus liabilities for U.S. households.
SOURCE: Federal Reserve Flow of Funds Report
Figure .
early in . The homeownership rate declined from its peak of . in to
. as of the fall of . Because so many American households own homes, and
because for most homeowners their housing represents their single most important
asset, these declines have been especially debilitating. Borrowing via home equity
loans or cash-out refinancing has fallen sharply.
At an FCIC hearing in Bakersfield, California, Marie Vasile explained how her
family had relocated miles into the mountains to a rental house to help her hus-
band’s fragile health. Their old home was put up for sale and languished on the mar-
ket, losing value. Eventually, she and her husband found buyers willing to take their
house in a “short sale”—that is, a sale at a price less than the balance of the mortgage.
But because the lender was acting slowly to approve that deal, they risked losing the
sale and then going into foreclosure. “To top this all off,” Vasile told commissioners,
“my husband is in the position of possibly losing his job. . . . So not only do I have a
house that I don’t know what’s happening to, I don’t know if he’s going to have a job
come December. This is more than I can handle. I’m not eating. I’m not sleeping.”
Serious mortgage delinquencies—payments that are late days or more or
homes in the foreclosure process—have spread since the crisis. Among regions, the