
Page 116 - untitled
P. 116
CREDIT EXPANSION
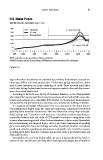
U.S. Home Prices
INDEX VALUE: JANUARY 2000 = 100
300
Sand states U.S. April 2006 201
250 U.S. total
200 Non-sand states
150
100
U.S. August 2010 145
50
0
1976 1980 1985 1990 1995 2000 2005 2010
NOTE: Sand states are Arizona, California, Florida, and Nevada.
SOURCE: CoreLogic and U.S. Census Bureau: 2007 American Community Survey, FCIC calculations
Figure .
ings netted these households an estimated billion; homeowners accessed an-
other billion via home equity loans. Some were typical second liens; others
were a newer invention, the home equity line of credit. These operated much like a
credit card, letting the borrower borrow and repay as needed, often with the conven-
ience of an actual plastic card.
According to the Fed’s Survey of Consumer Finances, . of homeowners
who tapped their equity used that money for expenses such as medical bills, taxes, elec-
tronics, and vacations, or to consolidate debt; another . used it for home improve-
ments; and the rest purchased more real estate, cars, investments, clothing, or jewelry.
A Congressional Budget Office paper from reported on the recent history:
“As housing prices surged in the late s and early s, consumers boosted their
spending faster than their income rose. That was reflected in a sharp drop in the per-
sonal savings rate.” Between and , increased consumer spending ac-
counted for between and of GDP growth in any year—rising above
in years when spending growth offset declines elsewhere in the economy. Meanwhile,
the personal saving rate dropped from . to .. Some components of spending
grew remarkably fast: home furnishings and other household durables, recreational
goods and vehicles, spending at restaurants, and health care. Overall consumer
spending grew faster than the economy, and in some years it grew faster than real
disposable income.
Nonetheless, the economy looked stable. By , it had weathered the brief re-
cession of and the dot-com bust, which had caused the largest loss of wealth in