Page 275 - 20dynamics of cancer
P. 275

260                                                CHAPTER 12

                                                    6 out of 16 cells
                                                    in the crypt ring
                                         Cell
                                       position

                                           7
                                                           4
                                           6
                                                           4
                                           5                            P
                                                          3 sc
                                           4                            P

                                                          2
                                           3                sc          P

                                                          2
                                           2                sc         P
                                                           S
                                           1


                                                       P    P P


                                                  P       Paneth cell
                                                  1p, 2p  Paneth lineage cells
                                                  S       Stem cell
                                                  1 sc    1st transit lineage CSC
                                                  2 sc    2nd transit lineage CSC

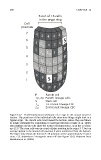
                              Figure 12.7  Three-dimensional schematic of a crypt in the mouse small in-
                              testine. The positions of the individual cells show how things might look in a
                              typical crypt. The Paneth cells tend toward the bottom, where they contribute
                              to innate immunity by responding to bacterial infection (Ayabe et al. 2000).
                              The numbers on the cells show the transit cell generation i, as in the T i of Fig-
                              ure 12.6. The stem cells vary in actual cellular position in the range 3–7, but on
                              average appear to be around cell position 4 when numbered from the bottom.
                              The figure only shows the bottom 7 cell positions of the approximately 15 posi-
                              tions. CSC abbreviates “clonogenic stem cell” (see Figure 12.6). Redrawn from
                              Marshman et al. (2002).
   270   271   272   273   274   275   276   277   278   279   280