
Page 165 - 20dynamics of cancer
P. 165
150 CHAPTER 8
Recall that d log(I)/d log(t) is the slope of the incidence curve, or ac-
celeration, when measured on a log-log scale. I called this measure the
log-log acceleration (LLA). Thus, the log-log slope of R is the difference
in acceleration between sporadic and inherited cases
d log (R)
ΔLLA = = LLA S − LLA I , (8.2)
d log (t)
in which ΔLLA denotes the difference in log-log acceleration.
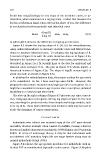
Figure 8.3 shows the log-log slope of R(ΔLLA) for retinoblastoma,
using unilateral incidence to measure sporadic cases and bilateral inci-
dence to measure inherited cases. To calculate the log-log slope of R,
I started in Figure 8.3a with the same incidence data as in Figure 8.2a.
Estimates for incidence at each age derive from many observations, as
described in Figure 2.6. I fit straight lines to the data for unilateral and
bilateral cases in Figure 8.3a. The plot in Figure 8.3c shows log(R),a
linearized version of Figure 8.2b. The slope of log(R) versus log(t) is
about one-half, as shown in Figure 8.3e.
In plotting the retinoblastoma data, the proper scaling for age needs
to be considered. So far, I have used age since birth. However, the
progression by somatic mutation may begin just after conception. So, it
might be reasonable to measure age in years since conception, obtained
by adding 0.75 years to age since birth.
The plots in the right column of Figure 8.3 measure age since concep-
tion. Using age since conception, the log-log slope in Figure 8.3f is near
one, matching the predicted value from simple multistage models, such
as in Eq. (6.3). These plots illustrate how incidence data may be used to
study the dynamics of cancer progression.
COLON CANCER
Individuals who inherit one mutated copy of the APC gene almost
invariably develop multiple colon tumors by midlife, causing a disease
known as familial adenomatous polyposis (FAP) (Kinzler and Vogelstein
2002). In terms of multistage theory, it may be that individuals with
an inherited APC mutation begin life one stage further along than do
normal individuals (Frank 2005).
Figure 8.4a shows the age-specific incidence for individuals with in-
herited FAP or noninherited (sporadic) colon cancer. Figure 8.4b plots