
Page 107 - 20dynamics of cancer
P. 107
92 CHAPTER 5
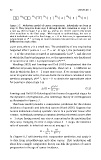
Y Y Y Y Y Y
Figure 5.2 Multistage model of cancer progression. Individuals are born in
stage 0. They progress from stage 0 through the first transition to stage 1 at
a rate u 0 , then to stage 2 at a rate u 1 , and so on. Severe cancer only arises
after transition to the final stage. With regard to epidemiology, the rate at
which individuals enter the final stage, n = 6 in this case, is approximately
proportional to t n−1 as long as cancer remains rare and the u i ’s are not too
different from each other.
u per year, where u is a small rate. The probability of any step having
happened after t years is 1 − e −ut ≈ ut. At age t, the probability that
n − 1 of the steps has occurred is approximately (ut) n−1 , and the rate
at which the final step happens is u, so the approximate rate (incidence)
n n−1
of occurrence at time t is proportional to u t .
Nordling (1953) and Armitage and Doll (1954) emphasized that the
different steps may happen sequentially. There are n − 1! different or-
ders in which the first n − 1 steps may occur. If we assume they must
occur in a particular order, then we divide the incidence calculated in the
n n−1
previous paragraph, u t ,by n − 1! to obtain the approximate value
for passing n steps at age t as
n n−1
u t
I n (t) ≈ . (5.1)
n − 1!
Armitage and Doll (1954) developed this theory of sequential stages for
the dynamics of progression—the multistage theory of carcinogenesis
as illustrated in Figure 5.2.
This basic model provides a comparative prediction for the relative
incidence of sporadic and inherited cancers (Frank 2005). Suppose that
normal individuals develop sporadic cancer in a particular tissue after
n steps. Individuals carrying a mutation develop inherited cancer after
n − 1 steps, having passed one step at conception by the mutation that
they carry. Using Eq. (5.1) for n steps versus n − 1 steps, the incidence
ratio of sporadic to inherited cancers at any age t is
I n ut
R = ≈ .
I n−1 n − 1
In Chapter 8, I will develop this comparative prediction and apply it
to data from retinoblastoma and colon cancer. That application will
show how a simple comparative theory can link the genetics of cancer
progression to the age of cancer incidence.