Page 270 - 16Neonatal Jaundice_compressed
P. 270

Neonatal jaundice


              Bibliographic details   Study type &   Patient characteristics   Test, Reference Standard,   Results                 Reviewers Comments
                                Evidence level                             Threshold for a positive test
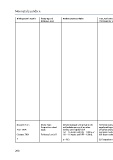
                                                                                                    RISK FACTOR SCORE

                                                                                                    c-statistic 0.71 (0.66–0.76)

                                                                                                    Risk index score 0–7
                                                                                                    +LR: 0.1

                                                                                                    Risk index score 8–11
                                                                                                    +LR: 0.4

                                                                                                    Risk index score 12–15
                                                                                                    +LR: 0.9

                                                                                                    Risk index score 16–19
                                                                                                    +LR: 2.0

                                                                                                    Risk index score 20–23
                                                                                                    +LR: 2.6

                                                                                                    Risk index score > 24
                                                                                                    +LR: 3.2

                                                                                                    PRE-DISCHARGE TSB

                                                                                                    c-statistic 0.83 (0.80–0.86)

                                                                                                               th
                                                                                                    TSB centile 0–40
                                                                                                    +LR: 0.05

                                                                                                                th
                                                                                                    TSB centile 41–75
                                                                                                    +LR: 0.2

                                                                                                                th
                                                                                                    TSB centile 76–95
                                                                                                    +LR: 2.2

                                                                                                               th
                                                                                                    TSB centile > 95
                                                                                                    +LR: 9.4


              Keren R et al.;   Study Type:     Infants managed exclusively in the   1) Factors associated with   Prevalence of significant   Unselected population
                                Prospective cohort   well infants nursery of an urban   significant hyperbilirubinaemia in   hyperbilirubinaemia   (stratified sampling) with well
              Year: 2008        study           tertiary care hospital with   univariate analysis entered into                     defined exclusion criteria
                                                GA = 36 weeks and BW = 2000 g or   regression modeling for clinical   48/751 (6.4%) – 61 had an incomplete   Baseline characteristics of two
              Country: USA      Evidence Level: II   GA = 35 weeks and BW = 2500 g   risk factor model                             groups not compared
                                                                                                    follow-up                      Confounding variables
              14                                n = 812                    2) Comparison of diagnostic     1) Association of factors with significant   controlled


            208
   265   266   267   268   269   270   271   272   273   274   275