
Page 261 - 16Neonatal Jaundice_compressed
P. 261
Appendix H: Evidence tables
Bibliographic details Study type & Patient characteristics Test, Reference Standard, Results Reviewers Comments
Evidence level Threshold for a positive test
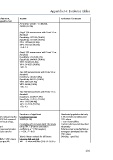
Prevalence of TSB > 15 MG/DL
59/498 (11.8%)
Single TSB measurement with Trend 12 as
threshold
Sensitivity: 127/129 (98.4%)
Specificity: 131/369 (35.5%)
PPV: 127/365 (34.8%)
NPV: 131/133 (98.5%)
+ LR: 1.5
Single TSB measurement with Trend 15 as
threshold
Sensitivity: 52/59 (88.1%)
Specificity: 344/439 (78.4%)
PPV: 52/147 (35.4%)
NPV: 344/351 (98.0%)
+LR: 4.1
Two TSB measurements with Trend 12 as
threshold
Sensitivity: 54/54 (100%)
Specificity: 84/121 (69.4%)
PPV: 54/91 (59.3%)
NPV: 84/84 (100%)
+LR: 3.3
Two TSB measurements with Trend 15 as
threshold
Sensitivity: 23/24 (95.8%)
Specificity: 117/151 (77.5%)
PPV: 23/58 (40.4%)
NPV: 117/118 (99.2%)
+LR: 4.3
Bhutani VK; Study Type: All term and near-term babies Test: Prevalence of significant Unselected population but only
Diagnostic study (either = 36 weeks GA and Pre-discharge TcB reading from the hyperbilirubinaemia 1.1% of study population had
Year: 2000 BW = 2000 g or = 35 weeks and forehead using BiliChek measured 30/490 (6.1%) TSB values
Evidence Level: 1b BW = 2500 g) discharged as healthy between 24 and 72 hours of age. > 256 micromol/litre
Country: USA from the well-baby nursery in a Correlation of TcB levels with TSB levels Test & Reference test described
tertiary hospital Reference standard: using HPLC (Pearson correlation adequately
36 Laboratory TSB measured at same coefficient, n = 1788 samples) Reference test a standard test as
n = 490, time as TcB, and also sent for r = 0.91, P < 0.01 nomogram developed from lab
observations=1788, HPLC assays. TSB values
mean BW 3404 ± 518 g, Paired TcB and HPLC TSB values Bland Altman analysis for difference Blinding – specified
between TSB and TcB
mean GA 38. 9 ± 1.5 weeks plotted on the hour-specific MD = -8 micromol/litre (95% CI -38.9 to
203