
Page 201 - Asterisk™: The Future of Telephony
P. 201
11 1 1 1 1 11 111 111 1 1 1 1 1 1 11 11 1 1
00 0 0 0 00 00 0 0 0 0000 0 0 0 0 0000 00 00 0 0
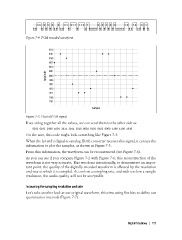
Figure 7-4. PCM encoded waveform
0110
0101
0100
0011
0010
0001
Amplitude 0000
1000
1001
1010
1011
1100
1101
Samples
Figure 7-5. Plotted PCM signal
If we string together all the values, we can send them to the other side as:
0011 0101 0100 1001 1011 1011 1010 0001 0101 0101 0000 1100 1100 1010
On the wire, this code might look something like Figure 7-4.
When the far end’s digital-to-analog (D/A) converter receives this signal, it can use the
information to plot the samples, as shown in Figure 7-5.
From this information, the waveform can be reconstructed (see Figure 7-6).
As you can see if you compare Figure 7-2 with Figure 7-6, this reconstruction of the
waveform is not very accurate. This was done intentionally, to demonstrate an impor-
tant point: the quality of the digitally encoded waveform is affected by the resolution
and rate at which it is sampled. At too low a sampling rate, and with too low a sample
resolution, the audio quality will not be acceptable.
Increasing the sampling resolution and rate
Let’s take another look at our original waveform, this time using five bits to define our
quantization intervals (Figure 7-7).
Digital Telephony | 173