
Page 178 - 49A Field Guide to Genetic Programming
P. 178
164 B TinyGP
1000
Avg Fitness
Best Fitness
100
Fitness
10
1
0 20 40 60 80 100
Generations
100
Avg Size
90
80
70
60
Average Size 50
40
30
20
10
0 20 40 60 80 100
Generations
2
sin(x)
GP (gen=99)
1.5
1
0.5
0
-0.5
-1
-1.5
-2
0 1 2 3 4 5 6
x
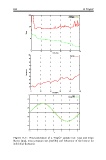
Figure B.1: Final generation of a TinyGP sample run: best and mean
fitness (top), mean program size (middle) and behaviour of the best-so-far
individual (bottom).