
Page 61 - untitled
P. 61
FINANCIAL CRISIS INQUIRY COMMISSION REPORT
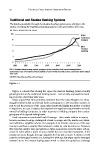
Traditional and Shadow Banking Systems
The funding available through the shadow banking system grew sharply in the
2000s, exceeding the traditional banking system in the years before the crisis.
IN TRILLIONS OF DOLLARS
$15
$13.0
Traditional
12 Banking
9
$8.5
Shadow
6 Banking
3
0
1980 1985 1990 1995 2000 2005 2010
NOTE: Shadow banking funding includes commercial paper and other short-term borrowing (bankers
acceptances), repo, net securities loaned, liabilities of asset-backed securities issuers, and money market mutual
fund assets.
SOURCE: Federal Reserve Flow of Funds Report
Figure .
Figure . shows that during the s the shadow banking system steadily
gained ground on the traditional banking sector—and actually surpassed the bank-
ing sector for a brief time after .
Banks argued that their problems stemmed from the Glass-Steagall Act. Glass-
Steagall strictly limited commercial banks’ participation in the securities markets, in
part to end the practices of the s, when banks sold highly speculative securities
to depositors. In , Congress also imposed new regulatory requirements on banks
owned by holding companies, in order to prevent a holding company from endan-
gering any of its deposit-taking banks.
Bank supervisors monitored banks’ leverage—their assets relative to equity—
because excessive leverage endangered a bank. Leverage, used by nearly every finan-
cial institution, amplifies returns. For example, if an investor uses of his own
money to purchase a security that increases in value by , he earns . However,
if he borrows another and invests times as much (,), the same in-
crease in value yields a profit of , double his out-of-pocket investment. If the
investment sours, though, leverage magnifies the loss just as much. A decline of
costs the unleveraged investor , leaving him with , but wipes out the leveraged
investor’s . An investor buying assets worth times his capital has a leverage