
Page 106 - 20dynamics of cancer
P. 106
PROGRESSION DYNAMICS 91
-RGMHIRGI WPSTI EFSYX
'SPSVIGXEP GERGIV
%KI
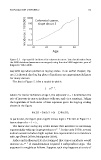
Figure 5.1 Age-specific incidence for colorectal cancer. Data for all males from
the SEER database (www.seer.cancer.gov) using the nine SEER registries, year of
diagnosis 1992–2000.
way with age when plotted on log-log scales. In an earlier chapter, Fig-
ure 2.2 showed that log-log plots of incidence are approximately linear
for many cancers.
The line in Figure 5.1 fits a model in which
I = ct n−1 ,
where I is cancer incidence at age t, the exponent n − 1 determines the
rate of increase in cancer incidence with age, and c is a constant. Taking
the logarithm of both sides of this equation gives the log-log scaling
shown in the figure
log (I) = log (c) + (n − 1) log (t) ,
in particular, the figure plots log(I) versus log(t). The line in Figure 5.1
has a slope of n − 1 ≈ 5.
The linear rise on log-log scales means that incidence is increasing
exponentially with age in proportion to t n−1 . In the early 1950s, several
authors wondered what might explain this exponential rise in incidence
with age (Frank 2004c; Moolgavkar 2004).
Fisher and Hollomon (1951) recognized that cancer incidence would
increase as t n−1 if transformation required n independent steps. The
argument is roughly as follows. Suppose each step happens at a rate of